
44, ASHBY CLOSE, BIRMINGHAM, B8 2RB - £290,000
The information on this page is based on a number of underlying datasets, most of which are updated monthly. We maintain an update schedule which explains which version of each dataset we are currently relying on.
44 ASHBY CLOSE is a midsized extended detached house of 108m², built sometime between 1996 and 2002, which could now be worth an estimated £297,170. It was last sold for £290,000 in October 2023, which was around 33% below the average October 2023 detached price in the Birmingham local authority area. The most recent EPC inspection was March 2023, where the current energy rating was C, and the potential energy rating was C.
44 ASHBY CLOSE Sold Prices
Land registry data shows two sales for 44 ASHBY CLOSE since 1st January 1995. The below table shows the price paid for the two sales, along with the average detached price in the Birmingham local authority area for the corresponding sale date. Both of the two 44 ASHBY CLOSE sales were for below the average price. The average price is sourced from the Office for National Statistics' House Price Index (HPI).
| Date | Price | HPI Price | Variation from HPI |
|---|---|---|---|
2023 20 OCT | £290,000 | £432,649 |  33% below HPI |
2011 19 SEP | £210,000 | £245,018 | 14% below HPI |
44 ASHBY CLOSE Price Paid vs. HPI Average
The below graph shows the average detached house price in the Birmingham local authority area over time, sourced from the HPI. The two 44 ASHBY CLOSE sales from September 2011 and October 2023 have been plotted on the graph. A line has been extrapolated to show what the value of the property might have been over time, following each sale, had it maintained the same margin above or below the HPI (as a percentage). For example, the September 2011 sale was for 14% below the HPI. So the extrapolation line tracks at 14% below the HPI over time, until the October 2023 sale, where it falls to 33% below the HPI. The line then continues to track at 33% below the HPI.

What might 44 ASHBY CLOSE be worth now?
44 ASHBY CLOSE might now be worth an estimated £297,170.
This is based on house price inflation of 2.5%, between October 2023 and July 2026, for detached houses, in the Birmingham local authority area, as calculated by the Office for National Statistics and published in their UK House Price Index (HPI).
The 2.5% inflationary increase is applied to the most recent sale price for 44 ASHBY CLOSE of £290,000 on 20th October 2023. For the value to have increased from £290,000 to £297,170 over the three years and three months to July 2026, the following assumptions must hold true:
- The value of 44 ASHBY CLOSE has moved in line with the HPI for detached houses in the Birmingham local authority area.
- The October 2023 sale price of £290,000 represented a fair market value for the property.
- The size, condition, and specification of 44 ASHBY CLOSE has not materially changed since October 2023.
How Large is 44 ASHBY CLOSE?
44 ASHBY CLOSE is 108m², which includes two extensions, according to the EPC inspection conducted in March 2023. This puts it in the smallest 50% of detached houses houses in Birmingham, based on EPC data. The below chart shows the distribution of detached houses houses by size in Birmingham, and where 44 ASHBY CLOSE lies on this distribution: 41% of detached houses houses are smaller than 44 ASHBY CLOSE, and 58% of houses are larger. Note that EPC data is not available for all properties in Birmingham.

44 ASHBY CLOSE: Plot and Title Map
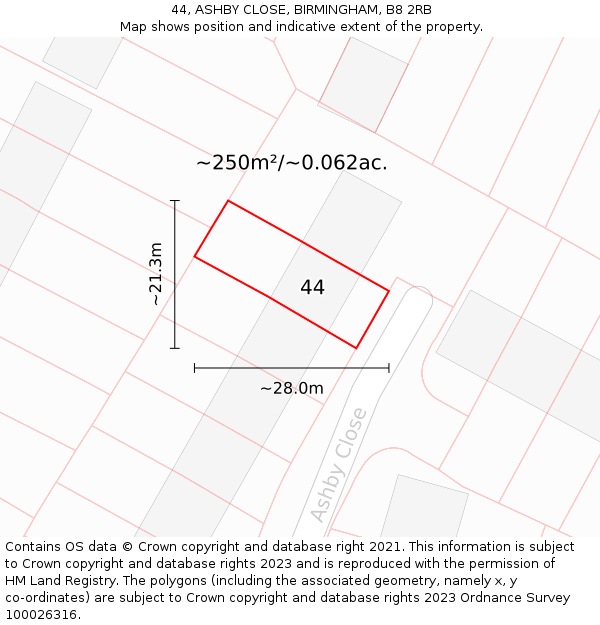
44 ASHBY CLOSE sits on a plot of roughly 0.062 of an acre, or 250m². The below map shows the location of 44 ASHBY CLOSE, an approximate outline of the building(s), and the indicative extent of the property. The plot extent is a Land Registry INSPIRE Index Polygon, and it is important to note that a title may include more than one polygon, whereas only one polygon is shown on the map (the polygon which intersects with the position of 44 ASHBY CLOSE). The full extent of the land contained in any registered title can only be identified from the individual title plan. The maps on this page should not be relied upon to establish the extent of a title.
Where is 44 ASHBY CLOSE?
44 ASHBY CLOSE is located in BIRMINGHAM, in the B8 postcode district. The below map shows the position of No. 44 on ASHBY CLOSE.

All property sales on ASHBY CLOSE
Most recent sales first:


- Contains OS data © Crown copyright and database right (2026)
- Contains Royal Mail data © Royal Mail copyright and Database right (2026)
- Contains National Statistics data © Crown copyright and database right (2026)
- Data produced by Land Registry © Crown copyright (2026)
- Contains Environment Agency data licensed under the Open Government Licence v3.0
- Everything else © GetTheData Publishing Limited (2026)
GetTheData.com is owned and operated by GetTheData Publishing Limited.
Company Number: 11075184 · Registered in England and Wales.
Registered Office: 3rd Floor, 86-90 Paul Street, London, England, EC2A 4NE
By accessing our site you agree to us using cookies, and sharing information about your use of our site, in accordance with our privacy policy.