GetTheData logo

41, HARPER DRIVE, MAIDENBOWER, CRAWLEY, RH10 7LD - £425,000

Advertisement

The information on this page is based on a number of underlying datasets, most of which are updated monthly. We maintain an update schedule which explains which version of each dataset we are currently relying on.

41 HARPER DRIVE is a very small terraced house of 78m², built sometime between 1991 and 1995. It was last sold for £425,000 in July 2026, which was around 24% above the average July 2026 terraced price in the Crawley local authority area. The most recent EPC inspection was July 2017, where the current energy rating was D, and the potential energy rating was B.

Get email updates on 41 HARPER DRIVE:
We will only use your email address to send you prioperty updates. You can ubsubscribe at any time. We will not pass you email address to anyone else. GetTheData is a UK company, registered with the ICO.

41 HARPER DRIVE Sold Prices

Land registry data shows five sales for 41 HARPER DRIVE since 1st January 1995. The below table shows the price paid for the five sales, along with the average terraced price in the Crawley local authority area for the corresponding sale date. All of the five 41 HARPER DRIVE sales were for above the average price. The average price is sourced from the Office for National Statistics' House Price Index (HPI).

DatePriceHPI PriceVariation from HPI
2026
24 JUL
£425,000£342,420
up arrow
24% above HPI
2017
31 OCT
£332,500£271,788
up arrow
22% above HPI
2007
19 DEC
£249,950£188,057
up arrow
33% above HPI
1999
10 FEB
£108,500£69,372
up arrow
56% above HPI
1995
30 JUN
£79,500£50,766
up arrow
57% above HPI

41 HARPER DRIVE Price Paid vs. HPI Average

The below graph shows the average terraced house price in the Crawley local authority area over time, sourced from the HPI. The five 41 HARPER DRIVE sales between June 1995 and July 2026 have been plotted on the graph. A line has been extrapolated to show what the value of the property might have been over time, following each sale, had it maintained the same margin above or below the HPI (as a percentage). For example, the October 2017 sale was for 22% above the HPI. So the extrapolation line tracks at 22% above the HPI over time, until the July 2026 sale, where it rises to 24% above the HPI. The line then continues to track at 24% above the HPI.

41, HARPER DRIVE, MAIDENBOWER, CRAWLEY, RH10 7LD: Price paid vs HM Land Registry's House Price Index

How Large is 41 HARPER DRIVE?

41 HARPER DRIVE is 78m² according to the EPC inspection conducted in July 2017. This puts it in the smallest 10% of terraced houses houses in Crawley, based on EPC data. The below chart shows the distribution of terraced houses houses by size in Crawley, and where 41 HARPER DRIVE lies on this distribution: 5% of terraced houses houses are smaller than 41 HARPER DRIVE, and 94% of houses are larger. Note that EPC data is not available for all properties in Crawley.

41, HARPER DRIVE, MAIDENBOWER, CRAWLEY, RH10 7LD: Size of property relative to terraced houses in Crawley

41 HARPER DRIVE: Plot and Title Map

41 HARPER DRIVE sits on a plot of roughly 0.056 of an acre, or 226m². The below map shows the location of 41 HARPER DRIVE, an approximate outline of the building(s), and the indicative extent of the property. The plot extent is a Land Registry INSPIRE Index Polygon, and it is important to note that a title may include more than one polygon, whereas only one polygon is shown on the map (the polygon which intersects with the position of 41 HARPER DRIVE). The full extent of the land contained in any registered title can only be identified from the individual title plan. The maps on this page should not be relied upon to establish the extent of a title.
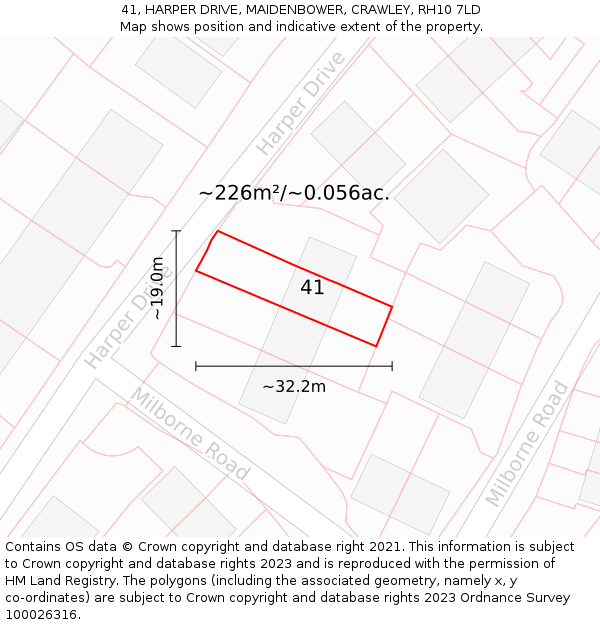
41, HARPER DRIVE, MAIDENBOWER, CRAWLEY, RH10 7LD: Plot and title map

Where is 41 HARPER DRIVE?

41 HARPER DRIVE is located in MAIDENBOWER, in the RH10 postcode district. The below map shows the position of No. 41 on HARPER DRIVE.

41, HARPER DRIVE, MAIDENBOWER, CRAWLEY, RH10 7LD: Location map and indicative extent of plot

All property sales on HARPER DRIVE

Most recent sales first:

Full data available
2026
24 JUL
£425,000
Full data available
2023
10 FEB
£560,000
Full data available
2022
12 OCT
£553,000
Full data available
2022
12 JUL
£635,500
Full data available
2021
26 APR
£480,000
Full data available
2020
19 MAY
£490,000
Full data available
2020
3 APR
£510,000
Full data available
2020
7 FEB
£452,500
Full data available
2018
31 OCT
£386,000
Full data available
2018
19 OCT
£520,000
Full data available
2017
3 NOV
£468,000
Full data available
2017
31 OCT
£332,500
Full data available
2017
25 OCT
£321,000
Full data available
2017
20 FEB
£369,950
Full data available
2016
26 FEB
£470,000
Full data available
2015
8 DEC
£375,000
Full data available
2015
16 JAN
£298,000
Full data available
2014
5 DEC
£345,000
Full data available
2013
30 OCT
£258,000
Full data available
2012
23 MAR
£230,000
Full data available
2011
16 SEP
£235,000
Full data available
2011
8 AUG
£249,950
Full data available
2011
17 JUN
£250,000
Full data available
2011
1 MAR
£332,500
Full data available
2010
17 NOV
£410,000
Full data available
2010
30 APR
£309,950
Full data available
2010
26 MAR
£350,000
Full data available
2007
19 DEC
£249,950
Limited data available
2007
24 AUG
£347,000
Limited data available
2007
9 FEB
£249,950
Full data available
2006
30 JUN
£200,000
Limited data available
2005
27 SEP
£285,500
Full data available
2005
19 AUG
£279,000
Full data available
2005
8 JUL
£267,500
Full data available
2005
30 JUN
£185,000
Full data available
2005
24 MAR
£280,000
Full data available
2004
12 OCT
£236,500
Full data available
2004
12 OCT
£322,500
Full data available
2004
30 JUL
£297,500
Full data available
2003
5 DEC
£248,000
Limited data available
2003
10 SEP
£269,950
Full data available
2002
16 DEC
£270,000
Limited data available
2002
9 OCT
£245,000
Full data available
2002
26 JUN
£173,000
Limited data available
2002
22 MAY
£220,000
Limited data available
2002
21 MAR
£249,950
Full data available
2002
8 FEB
£211,000
Full data available
2001
6 APR
£123,000
Full data available
2000
23 OCT
£151,000
Limited data available
1999
10 SEP
£159,950
Limited data available
1999
12 AUG
£149,950
Full data available
1999
27 MAY
£134,950
Limited data available
1999
31 MAR
£142,000
Full data available
1999
19 FEB
£110,000
Full data available
1999
10 FEB
£108,500
Full data available
1998
23 OCT
£171,000
Full data available
1998
14 AUG
£103,000
Full data available
1998
17 JUL
£110,000
Full data available
1998
9 APR
£165,500
Limited data available
1998
27 FEB
£129,000
Full data available
1997
30 JUN
£145,000
Full data available
1997
30 JUN
£149,950
Full data available
1997
17 APR
£124,000
Full data available
1997
27 MAR
£116,000
Limited data available
1997
27 MAR
£145,000
Limited data available
1997
26 MAR
£113,000
Full data available
1997
20 MAR
£132,500
Limited data available
1997
28 FEB
£147,000
Full data available
1997
14 FEB
£97,000
Full data available
1996
20 DEC
£108,000
Limited data available
1996
19 DEC
£116,500
Full data available
1996
29 NOV
£72,950
Limited data available
1996
30 SEP
£106,000
Full data available
1996
27 SEP
£101,950
Limited data available
1996
30 AUG
£112,950
Limited data available
1996
14 JUN
£109,200
Full data available
1996
3 JUN
£109,950
Limited data available
1996
16 MAY
£99,950
Limited data available
1996
26 APR
£109,950
Full data available
1996
29 MAR
£105,000
Limited data available
1995
18 DEC
£132,500
Full data available
1995
20 OCT
£98,000
Full data available
1995
11 AUG
£113,000
Full data available
1995
14 JUL
£109,000
Full data available
1995
30 JUN
£79,500
Full data available
1995
26 MAY
£82,000
Full data available
1995
26 MAY
£83,500
Full data available
1995
19 MAY
£83,000
Full data available
1995
12 MAY
£66,950
Limited data available
1995
12 MAY
£82,500
Limited data available
1995
5 MAY
£88,950
Limited data available
1995
28 APR
£83,500
Full data available
1995
28 APR
£83,500
Full data available
1995
25 APR
£83,000
Source: HM Land Registry Price Paid Data
Licence: Contains HM Land Registry data © Crown copyright and database right 2026. This data is licensed under the Open Government Licence v3.0.
Source: HM Land Registry UK House Price Index
Licence: Contains HM Land Registry data © Crown copyright and database right 2026. This data is licensed under the Open Government Licence v3.0.
Copyright statement: This information is subject to Crown copyright and database rights 2026 and is reproduced with the permission of HM Land Registry. The polygons (including the associated geometry, namely x, y co-ordinates) are subject to Crown copyright and database rights 2026 Ordnance Survey 100026316. Conditions of use.