Violence and sexual offences
➔
Unable to prosecute suspect
Police data on 20 crimes reported on Notley Place, including 11 violent or sexual offences, three incidents of anti-social behaviour, three public order incidents, and one burglary. The data covers the period February 2021 to January 2024.
The most common crime type on Notley Place was Violence and sexual offences, which accounted for 11 crime reports. There were three reports of Anti-social behaviour, three reports of Public order, one report of Burglary, and two further reports covering two additional crimes types.
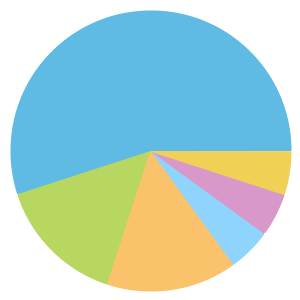
# | Crime | % |
|---|---|---|
11 | Violence and sexual offences | 55% |
3 | Anti-social behaviour | 15% |
3 | Public order | 15% |
1 | Burglary | 5% |
1 | Criminal damage and arson | 5% |
1 | Vehicle crime | 5% |
0 | Bicycle theft | 0% |
0 | Drugs | 0% |
0 | Other crime | 0% |
0 | Other theft | 0% |
0 | Possession of weapons | 0% |
0 | Robbery | 0% |
0 | Shoplifting | 0% |
0 | Theft from the person | 0% |
The most common outcome of crimes reported on Notley Place was Unable to prosecute suspect, which was the outcome in eight crime reports. Four crime reports had outcomes of Action to be taken by another organisation, four crime reports had outcomes of Investigation complete; no suspect identified, and one crime report had an outcome of Offender given a caution.
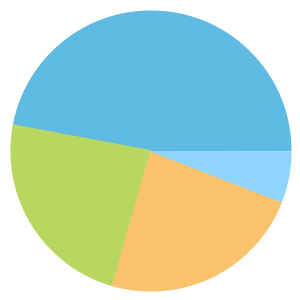
# | Outcome | % |
|---|---|---|
8 | Unable to prosecute suspect | 47% |
4 | Action to be taken by another organisation | 24% |
4 | Investigation complete; no suspect identified | 24% |
1 | Offender given a caution | 6% |
0 | Awaiting court outcome | 0% |
0 | Court result unavailable | 0% |
0 | Formal action is not in the public interest | 0% |
0 | Further action is not in the public interest | 0% |
0 | Further investigation is not in the public interest | 0% |
0 | Local resolution | 0% |
0 | Offender given a drugs possession warning | 0% |
0 | Offender given penalty notice | 0% |
0 | Status update unavailable | 0% |
0 | Suspect charged as part of another case | 0% |
0 | Under investigation | 0% |
GetTheData.com is owned and operated by GetTheData Publishing Limited.
Company Number: 11075184 · Registered in England and Wales.
Registered Office: Advantage, 87 Castle Street, Reading, Berkshire, England, RG1 7SN
By accessing our site you agree to us using cookies, and sharing information about your use of our site, in accordance with our privacy policy.